Building an AI Financial Analyst on Warren Buffett's Principles
An AI financial analyst inspired by Warren Buffett: Moat AI's architecture, iterations, costs, and engineering lessons, with six published analyses.
Moat AI is a research prototype that analyzes listed companies using investment principles published by Warren Buffett. It reads company reports, assesses the business and its management, estimates a value range, and explains the result.1
The research question is whether these agents can apply a written method with evidence we can check. We follow how observed failures changed the design, how agents handle uncertainty, and whether the final report preserves their findings. This case study does not establish that their financial judgments are correct.
Six company analyses are presented on Moat AI. The examples below also draw on earlier development experiments.2
Why Buffett, and why seven questions?
We chose Warren Buffett because his investment approach is widely known and unusually well documented. Decades of public shareholder letters provide a substantial primary-source corpus, with explanations of business quality, management, and price. That gives us a concrete method to translate into research tasks and inspect against company filings.1
In his 1977 shareholder letter, Warren Buffett describes four criteria: a business he can understand, favorable long-term prospects, honest and competent management, and an attractive price.3
We translate the first three into seven assessment questions, informed by later letters on earning power, competitive advantages, debt, candor, and capital allocation:
| Buffett’s criterion | What the agents investigate |
|---|---|
| Understand the business | 1. Is its business model simple and stable?4 |
| Long-term prospects | 2. Has it demonstrated consistent earning power?5 3. Does it have a durable competitive advantage?6 4. Does it earn good returns with little or no debt?7 5. Is the business free of a major risk that could cause a permanent loss?8 |
| Management | 6. Is management candid and trustworthy?9 7. Does its allocation of capital create value for shareholders?10 |
The fourth criterion, price, gets a separate task: estimate the cash available to owners, then calculate a value range and compare it with the share price.11 That makes seven qualitative investigations plus one earnings estimate.
We designed these seven questions to make Buffett’s broader criteria easier to investigate. Each agent gets one question and its supporting letter passages, then returns yes, no, or unclear with evidence.
One question per agent run keeps each investigation focused. Separate conversations prevent an earlier answer from anchoring the next one. An agent assessing management, for example, does not see another agent’s favorable view of the business. This is a design intended to reduce cross-question bias, not proof that the judgments are unbiased.
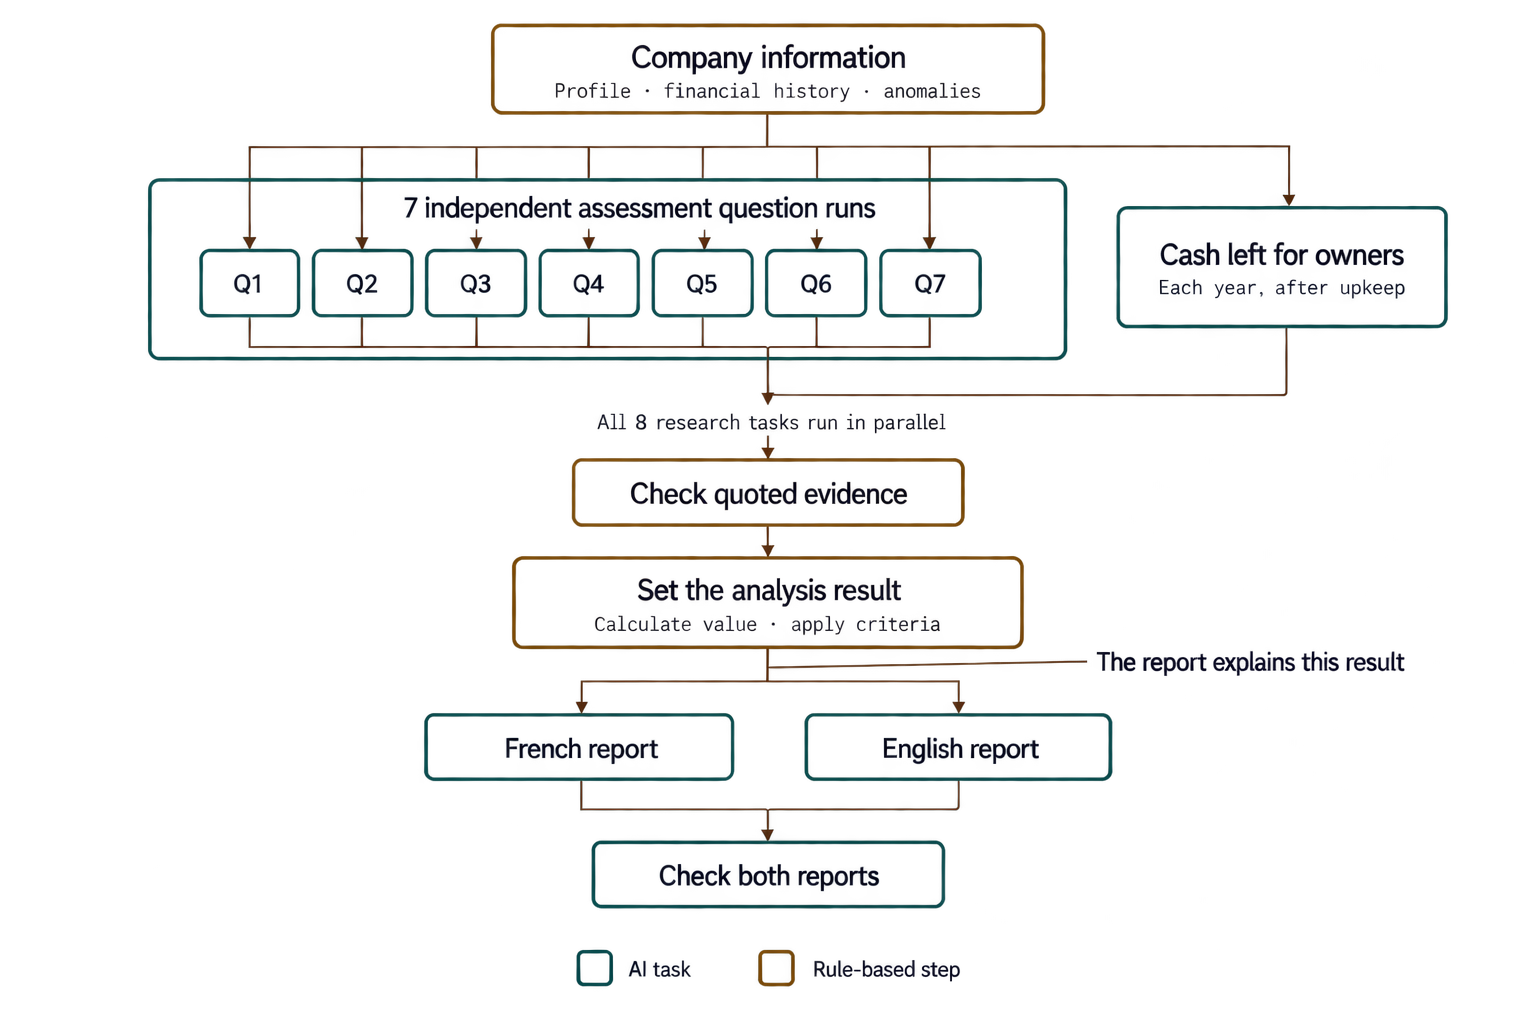
In the default one-pass setup, all eight research tasks run in parallel: seven assessment questions and one owner-earnings estimate. Each conversation remains separate, even when the runs use the same model and tools. When repetition is enabled, the additional attempts share the same limit of eight active runs.
Fixed rules turn those answers and the price comparison into a result. These decision rules are our implementation of the four criteria, including our treatment of uncertainty:
- Positive: all four criteria are met, including a price at or below our conservative value estimate.
- Negative: at least one criterion fails, even if others remain uncertain.
- Watch list: none fails, but missing evidence or an inconclusive price comparison prevents a positive result.
Which data feeds the analysis?
- SEC/EDGAR, through edgartools: company reports and structured financial figures in XBRL format. EDGAR is the SEC’s public filing system.12
- Yahoo Finance, through yfinance: prices, market history, market capitalization, stock splits, currencies, and the 30-year US government bond yield.
- Warren Buffett’s letters to Berkshire Hathaway shareholders: evaluation principles, rather than evidence about the company being studied.1
A 10-K is a US company’s annual report. 20-F serves foreign issuers, and 40-F eligible Canadian issuers. These annual filings describe the business, risks, financial statements, and explanatory notes. A 10-Q provides quarterly financial updates.13
Ratios and values are calculated from these inputs. The documents let agents investigate why figures changed, what cash spending supports earnings, and which liabilities or disputes a summary might omit.
Seven iterations guided by failures
Iteration 1 — Define what to inspect
The prototype supplied a value without an inspectable calculation. We made the criteria explicit and separated calculations from judgments.
For example, an early Coca-Cola (KO) analysis reached a defensible verdict while missing important evidence. We began evaluating the investigation’s coverage alongside its conclusion.
Iteration 2 — Make the evidence accessible
We initially cut each filing section off after 6,000 characters to limit the text entering the model’s context. In hindsight, this saved space by hiding evidence the agent needed. For example, the Coca-Cola (KO) analysis identified the tax dispute without quantifying it.
We replaced the cutoff with full-text search and paginated reading, so agents could reach the complete document as needed. This exposed a $6 billion tax deposit and other cash-flow explanations. Checklist coverage rose from 3/7 to 7/7, with several settings changed together.
Iteration 3 — Stop losing useful research
The output format allowed only four quotations. Two responses were lost when they exceeded that cap. Removing it allowed the risk answer to return with seven quotations.
Other failures came from exhausted provider credits: the same missing answer could hide different causes.
Iteration 4 — Guide the investigation
We expanded the financial history and flagged anomalies to explain: falling earnings, rising debt, or cash flow far below profit. An agent finishing before six filing-related calls was sent back once. This discouraged premature stopping without establishing how deeply the documents were read.
Iteration 5 — Separate uncertainty from error
For example, during a Copart (CPRT) analysis, the price was attractive but the legal risk unquantifiable. We introduced a watch-list outcome to distinguish uncertainty from a failed criterion.
In another example, an Intel (INTC) estimate returned 2,000 instead of roughly two billion, motivating a scale check.
Iteration 6 — Repeat and retain the attempts
To examine variable answers, we added majority votes and median estimates.
For example, during a Copart (CPRT) analysis, all seven questions agreed after two attempts each while the reader still missed a financial note. We repaired that access path and retained every attempt and its evidence to understand agreement and disagreement.
Iteration 7 — Check what the reader sees
Final reports omitted facts or changed the reason for uncertainty. We aligned their figures with the interface and added automatic review against the underlying analysis.
For example, in the Microsoft (MSFT) analysis, this review recorded four correction entries. A later tool-using audit documented twelve categories of remaining issues. These entries can each cover several changes, so the counts do not establish a detection rate.
The resulting architecture
Figure 1 shows the order of work: investigate, apply decision rules, then write. This keeps the report grounded in a result established before writing:
- Investigate: answer seven questions about the business and estimate the yearly cash left for owners, after spending what is needed to maintain the business.
- Decide: explicit rules combine those findings and calculate values to establish the analysis result.
- Explain: the writer receives that result and its evidence, then turns them into a readable report.
Q1–Q7 refer to the seven assessment questions introduced above, from understanding the business to evaluating capital allocation.
The diagram’s “The report explains this result” means that writing explains the positive, negative, or watch-list outcome already set by the rules. It does not reassess that outcome.
Self-consistency: handling LLM variability
An LLM does not guarantee deterministic outputs. The same question can produce different research paths and verdicts.
Wang and colleagues call their approach self-consistency: sample several reasoning paths, then vote on their final answers instead of relying on a single path.15
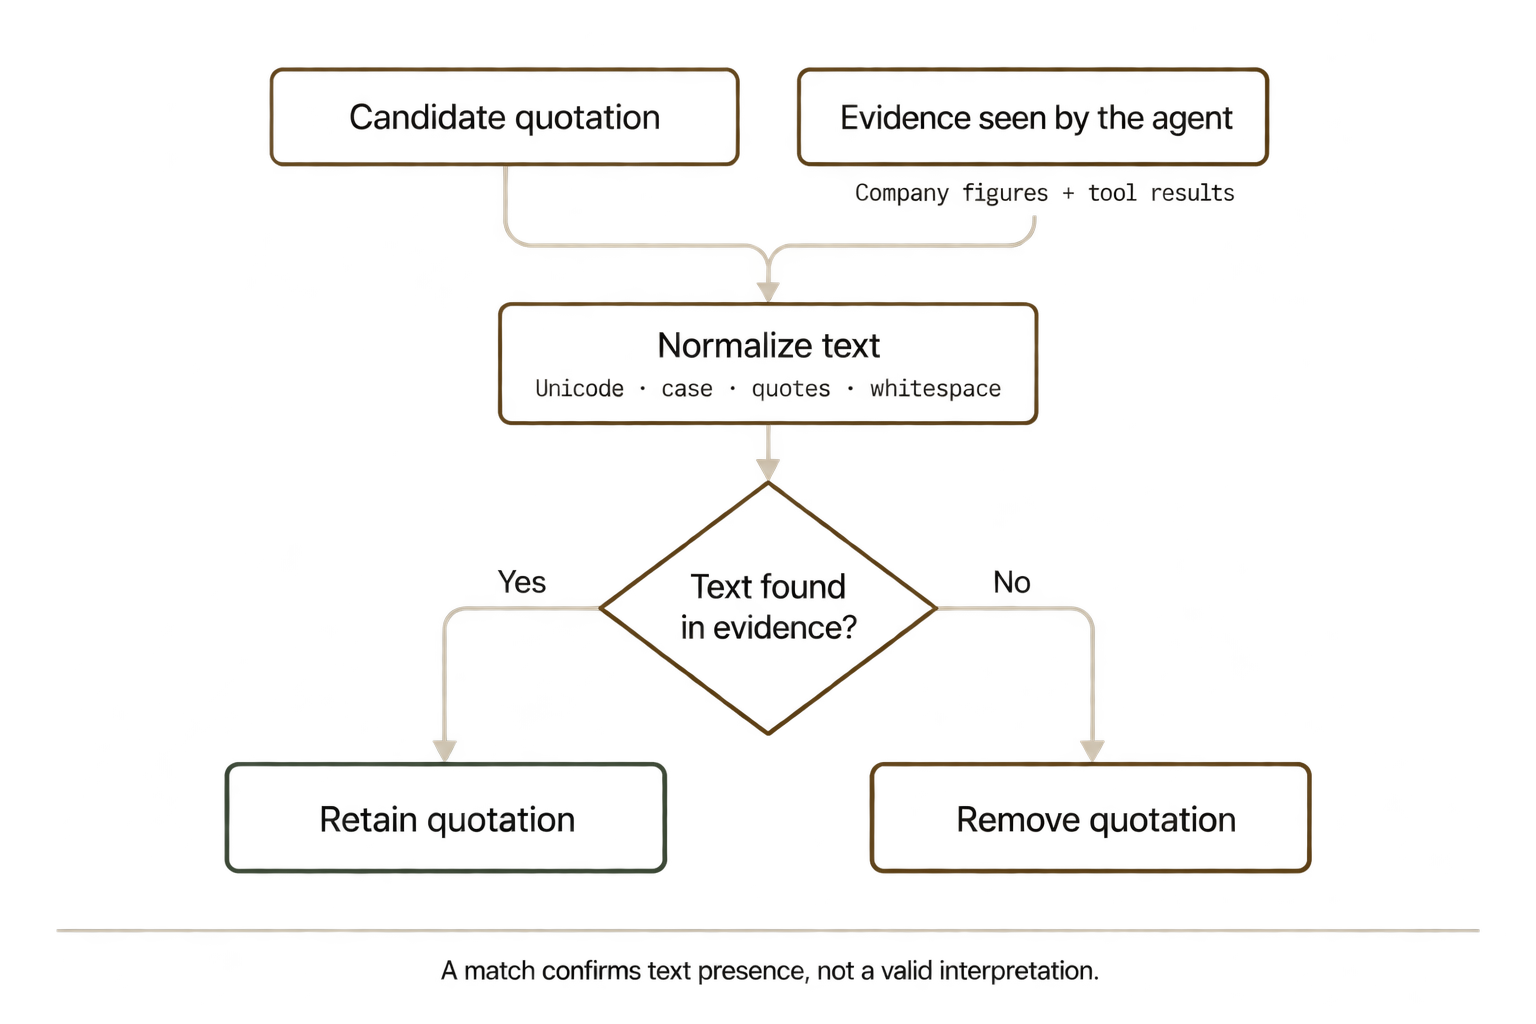
Our adaptation repeats entire investigations with tools. For each qualitative question, two attempts suffice when they agree. Otherwise, a third is requested. Without a majority, the answer remains uncertain. Quotations are checked before voting.
In the repetition setup described here, we request three valuation investigations and take medians of their valid estimates, rather than voting on share values. Failed attempts are excluded, so fewer than three estimates may remain. The default one-pass setup uses one investigation. This stopping rule and numerical aggregation are our design choices.
This examines stability. The Copart example illustrates why agreement does not establish completeness. The benefit to accuracy still needs measurement.
Two checks, two limits
1) Finding a quotation does not validate its interpretation
Figure 2 shows a text-presence check: a quotation is retained when its normalized text occurs in the figures or tool results received by the agent. A match does not establish correct attribution, relevant evidence, or a complete investigation.
2) Calculating a value does not validate its assumptions
Buffett’s owner earnings concept estimates cash left for owners after spending needed to maintain the business, including additional working capital where required. Discounting converts future cash into a value today.16
The LLM chooses the annual cash and growth estimates, guided by historical accounts, documents, and instructions. Code supplies reference calculations, applies checks, and calculates the per-share values. It does not independently validate those estimates.
We chose a constant-growth perpetuity as a simple, inspectable baseline. It assumes cash grows by the same percentage every year, forever. This is our modeling choice, not a formula established as Buffett’s own.17
Value per share = E × (1 + g) / ((r − g) × N)
E is annual owner earnings, g growth, r the discount rate, and N the share count. We use the 30-year US Treasury yield as a long-term reference return, without an equity risk premium. It is not a company-specific required return.
“Conservative” describes the intended assumptions, not a demonstrated conservative valuation. My focus is AI systems engineering, and I am not a finance expert. These values remain experimental.
Valuation details: assumptions and limitations
Estimating cash and growth. Code supplies historical profit, depreciation, capital spending, and a starting calculation of profit plus depreciation minus all capital spending. The LLM is asked to investigate exceptional years, distinguish maintenance from growth investment, and justify two cash-and-growth scenarios with quotations and calculator results.
Growth is informed by historical revenue and earnings, debt changes, retained profits, and returns on added capital. Code caps the cautious-input growth rate at a historical financing-based estimate when available. These instructions and checks do not independently reconstruct and reconcile every estimate. To interpret the output as equity value, cash must reflect the relevant reinvestment and financing needs consistently with the discount rate.17
Constant growth. At 2% annual growth, $100 becomes $102 next year and $104.04 the following year. The formula sums the present value of that assumed cash stream indefinitely.
Why the 30-year Treasury? Its yield provides an observable benchmark for lending to the US government. We chose a long-term rate to represent long-lived cash flows, not a calculation limited to 30 years. We have not established that this maturity is best. A higher discount rate would lower the value at unchanged cash and growth assumptions. Our rate does not explicitly compensate for equity risk.17
Sensitivity cutoff. The formula requires g < r and becomes highly sensitive as the rates converge.18 For example, an ASML analysis used 5% growth against a 5.29% rate and produced a likely value near $8,932 per share. We now suppress values when the gap is below 1.5 percentage points. This is our safeguard, not an economic validation. Values above the cutoff can still be inappropriate.
A possible alternative. A two-stage discounted cash-flow model could use different growth assumptions for an initial period and a mature phase.17 We have not tested it here or demonstrated greater reliability. Choosing between methods would require financial expertise and comparison on the same evidence.
How much does an analysis cost?
Five one-pass analyses averaged $1.72, versus $3.84 for two analyses with repetition: about 2.2 times as much. Companies and settings differ, so this is not a controlled comparison.19
For example, the recorded Microsoft (MSFT) analysis separates the writing and review charges:
| Stage | Cost |
|---|---|
| Research and valuation | $1.57 |
| French note | $0.14 |
| English note | $0.11 |
| Review of both notes | $0.26 |
| Total | $2.08 |
The second language and review added $0.37, or about 22%. One pass remains the default. We have not established that it is equally accurate as repetition.
Five transferable lessons
- Inspect access to evidence. In the Coca-Cola and Copart examples, an incomplete tool constrained the investigation.
- Define each check’s scope. Counting calls or finding a quotation measures a behavior, not the whole quality of reasoning.
- Evaluate the final output. Written reports omitted or misrepresented findings despite an unchanged verdict.
- Equip the reviewer. In the Microsoft example, the later audit had details and tools absent from automatic review. Model choice alone cannot explain its better coverage.
- Retain unselected attempts. Traces help explain disagreement and distinguish genuine uncertainty from technical failure.
What we built, and where we go next
We set out to build an analyst whose work we could inspect. The result is a working pipeline that connects company evidence, explicit decision rules, and reviewed reports. The experiments give us concrete engineering results and a clear agenda for evaluating financial reliability.
| Goal | What we achieved | Next evaluation |
|---|---|---|
| Make research inspectable | Agents read filings, with quotation checks and traces available for inspection | Measure coverage of material facts and accuracy of interpretation |
| Make decisions explainable | Explicit rules combine findings with visible valuation inputs and calculations | Assess valuation assumptions and usefulness with domain experts |
| Handle variable answers | Repeated investigations can be combined, with their costs recorded | Compare accuracy and cost with and without repetition |
| Preserve findings in the final report | Automatic review ran and recorded corrections in a saved analysis | Measure which errors review catches and which remain |
These are engineering observations from a small corpus, with several changes tested together. Controlled comparisons and better-equipped review are the next steps.
I am excited by how far this project has come. We turned published investment principles into a working system with inspectable evidence, explicit calculations, and reports we can review. Each iteration helped us find a failure, understand its cause, and improve the harness.
That gives us a concrete foundation for the next experiments.
Explore the project at moat-ai.heronlab.dev.
Continue the conversation
Discuss your project
Interested in Moat AI, an automation, or a research question? Tell me about the problem you would like to explore.
Or connect on LinkedIn.
Footnotes
-
Warren Buffett’s shareholder letters, available on the official Berkshire Hathaway website. ↩ ↩2 ↩3
-
The site retains one recent analysis per company. Iteration examples also draw on earlier development experiments. The Coca-Cola checklist was retrospective; the output reaching 7/7 remained incomplete after two responses were rejected. This engineering case study is not investment advice. Figures generated with ChatGPT and checked. ↩
-
The four criteria come from the stock-selection discussion in the 1977 shareholder letter. The seven-question decomposition is ours. The project’s method page also presents the motivating passages. ↩
-
Question 1: 1982, acquisition criteria, on simple businesses, and 1992, discussion of estimating future cash flows, on businesses that are simple and stable. We translate these principles into an assessment question. ↩
-
Question 2: 1982, acquisition criteria, on demonstrated consistent earning power rather than forecasts or turnaround promises. Using this acquisition criterion to guide our listed-company investigations is our operationalization. ↩
-
Question 3: 2007 shareholder letter, discussion of an enduring competitive moat that protects returns on invested capital. ↩
-
Question 4: 1982, acquisition criteria, on good returns on equity with little or no debt. Our measurements and interpretation of what counts as little debt are implementation choices. ↩
-
Question 5: 1993, discussion of risk, on economic loss rather than share-price volatility, and 1992, on avoiding major mistakes. The question and list of risks to investigate are our interpretation, not a Buffett checklist or proof that risk is absent. ↩
-
Question 6: 1977, on honest and competent management, and 1983, owner-related business principles, on candid reporting of both positives and negatives. The latter describes Berkshire’s own reporting policy. Applying it to other companies is our extension. ↩
-
Question 7: 1984, dividend policy, on value created by retained earnings, and 1987, capital allocation, on management’s allocation skills. Our investigation combines these ideas rather than reproducing a published questionnaire. ↩
-
Price assessment: 1977 supplies the attractive-price criterion. 1992 explains discounted future cash flows and a margin of safety. The constant-growth formula, exact reference rate, scenario comparison, and thresholds used here are our implementation choices. ↩
-
SEC, About EDGAR and access to filings and XBRL financial data. ↩
-
SEC investor guides to Form 10-K and Form 10-Q. For foreign issuers, see Form 20-F and the SEC’s Financial Reporting Manual, section 16210 on Canadian issuers. ↩
-
Automatic review is attempted only when both reports were generated. If it fails, the unrevised reports can remain. Earlier development experiments did not all include these stages. A change to the reviewer model has been implemented but not yet evaluated in an archived analysis. ↩
-
Wang et al., Self-Consistency Improves Chain of Thought Reasoning in Language Models, ICLR 2023. Their reasoning-benchmark results do not validate our financial application. ↩
-
Warren Buffett’s 1986 shareholder letter, appendix on owner earnings, and 1992 shareholder letter, discussion of discounted cash flows. These support the valuation principles; our constant-growth assumption and choice of discount rate remain implementation choices. ↩
-
Aswath Damodaran, Free Cash Flow to Equity Discount Models, covers stable-growth, two-stage, and three-stage models. It supports the valuation structure, not equivalence between our owner-earnings estimates and FCFE, nor our discount-rate choice. ↩ ↩2 ↩3 ↩4
-
Aswath Damodaran, NYU Stern, The Stable Growth Rate. This source explains growth sensitivity without prescribing our 1.5-point threshold. ↩
-
Historical provider-reported charges, excluding manual audits. Samples: $8.5838 for five one-pass analyses; $7.6784 for two with repetition. Microsoft costs come from recorded calls. Totals calculated before rounding; no current price or causal improvement is claimed. ↩